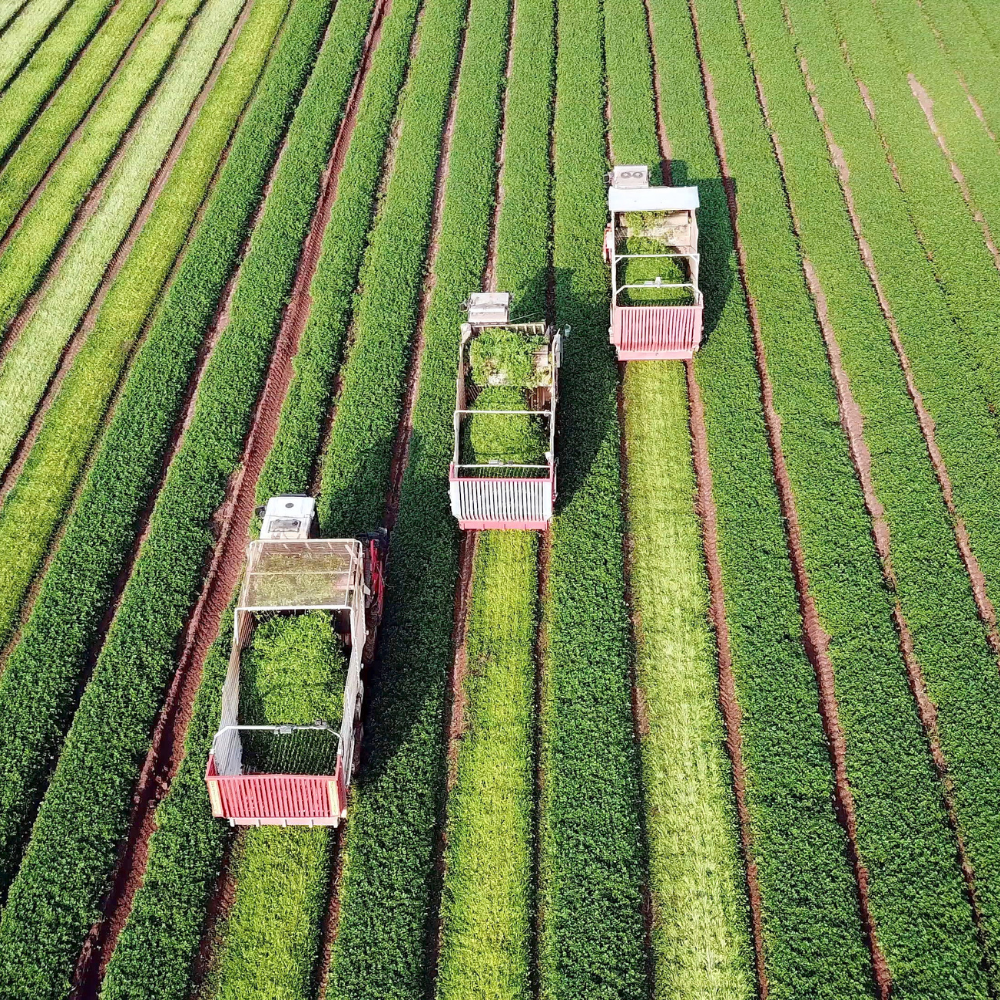


Trusted data, executive BI, and practical AI for agriculture and nutrition businesses
Agriculture runs on seasons. When sales, inventory, and finance each keep their own spreadsheets, nobody sees the whole season. We consolidate your commercial and financial data into one governed model and put the KPIs that run the business on a single executive page.
Whether you produce, distribute, or both, the questions are the same:
We build the governed data foundation that answers them, powers your reporting, and gets your operation ready for practical AI that we train on your data and your problems

The data exists. It is just spread across systems that were never designed to talk to each other
Orders, dealer sales, and field data sit in systems that never meet your finance system, so commercial and financial truth never line up
Margin by product and region is distorted by month end cutoffs and shifting input costs, so decisions rely on last season's guesswork
Sales and executive reports are rebuilt in spreadsheets every month, which is slow, prone to error, and different every time
Agronomy tools, order systems, CRM, and your ERP each hold a piece of the picture. Nobody holds the whole season
Exports, rekeying, and reconciliation eat the first week of every month before anyone sees a number they trust
Inconsistent product codes, regions, and units of measure mean the same question gets three different answers
We build on the Microsoft stack you already own. No new platforms to buy and nothing to rip out and replace

Fabric and OneLake become the governed store where your sales, inventory, and finance data meet. One model, one set of definitions, ready for BI and AI
An executive page your leadership opens every morning: sales, margin, and inventory KPIs on one screen, reconciled to the GL

With a governed foundation in place, data agents can answer seasonal questions in plain language, from regional sales trends to which costs are drifting off plan



The KPI topics that make it onto your executive page and the kinds of outcomes the work is aimed at
Revenue and margin by product line, region, and rep, reconciled to your financials and refreshed daily
Season over season comparisons that follow your growing cycle, not the calendar
Stock, input costs, and availability in one place, so you order and produce with confidence
Dealers, retailers, and end customers joined to sales, showing who actually drives the business
True margin by product and customer as input costs shift, so pricing protects the season
A governed model that supports seasonal forecasting today and AI agents tomorrow, built once and reused everywhere

Nick and his team built Power BI reports for our 30 person sales team that are second to none. Beyond the reports themselves, they helped us understand our business in ways we just did not have visibility into before
Marketing Director, Agriculture Business
A short discovery call where we go over your systems, your biggest problems, and if we're the right fit
We connect to your systems, bring the data into Fabric, and build governed data model
Your executive page goes live. Then we refine it with your team as questions evolve

Book a call and we'll show you a live agriculture executive dashboard
Book a Call with Nick